
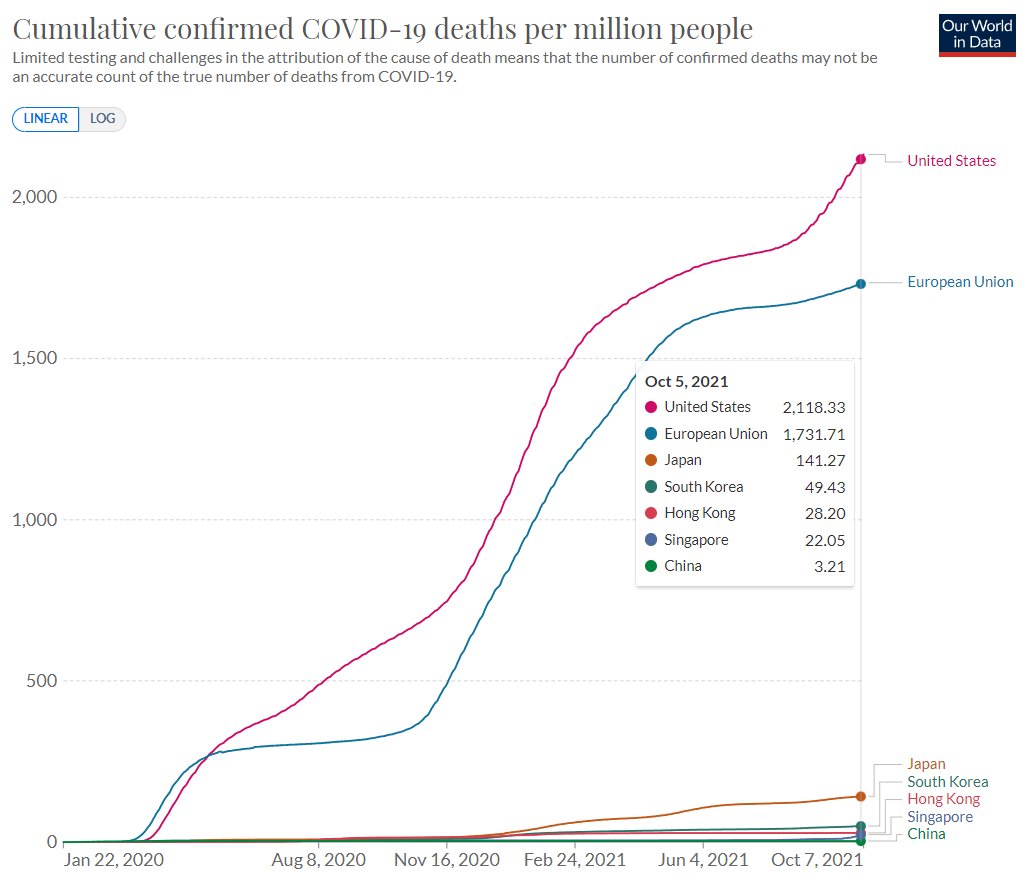
This is astonishing. The deaths in the graph are per million population.
One explanation:
 Another:
 A combination?
This is astonishing. The deaths in the graph are per million population.
One explanation:
Another:
A combination?


| Lucille on General Discussion, Wednesday,… | |
| Lucille on General Discussion, Wednesday,… | |
| Lucille on It’s Doggityday! | |
| Lucille on It’s Doggityday! | |
| czarina33 on General Discussion, Tuesday, J… | |
| WeeWeed on Lettuce bad – Chocolate… | |
| Lucille on General Discussion, Tuesday, J… | |
| Lucille on General Discussion, Tuesday, J… | |
| Reflection on General Discussion, Tuesday, J… | |
| Reflection on General Discussion, Tuesday, J… | |
| WeeWeed on General Discussion, Tuesday, J… | |
| texan59 on General Discussion, Tuesday, J… | |
| Lucille on General Discussion, Tuesday, J… | |
| Lucille on General Discussion, Tuesday, J… | |
| Lucille on General Discussion, Tuesday, J… |

I checked the data. It’s correct. Here’s the link:
https://ourworldindata.org/covid-deaths?country=IND~USA~GBR~CAN~DEU~FRA~CHN~JPN~KOR#country-by-country-data-on-confirmed-deaths
LikeLiked by 1 person
I selected the countries to include.
Page down to “Cumulative confirmed deaths per million people”.
LikeLiked by 1 person
Data sources:
LikeLiked by 1 person
What’s odd is they say the recovery rate is better than 99% from covid. Are these listed as with covid or because of covid, or both???
LikeLiked by 1 person
Who knows. I suppose it depends on the country reporting.
LikeLiked by 1 person